

When Reports is initially accessed in any job file, the Reports - Report dialog is automatically displayed. The same dialog is displayed when the New Report command is initiated. In this dialog the default option, Create Report, will create a "dynamic report" based on the contents of the project and the options selected in the dialog.
Details:
- Generated reports contain dynamic pages with dynamic content. Dynamic pages are automatically added as needed; this is referred to as "propagation." For example, an additional page will be added for each additional Viewport from Model Mode.
- The contents of the Dynamic Report are managed by proxies (placeholders). The proxies are automatically filled with content as available in the AGi32 model.
- When a report is initially created, all pages are of the same size. Variable page size may be specified in the Report Properties command in the Reports Toolkit.
- Unwanted pages may be deleted.
- If Render images do not appear or appear all black, you may need to adjust the computer's Hardware Acceleration setting. (This may be done in AGi32 via System Settings - Advanced.)
Creating a Dynamic Report
- Add Viewpoints in Model Mode. (Recommended: use a meaningful name, e.g., Room_1, Isometric View, etc.).
- Add Viewpoints in Render Mode. (Recommended: use a meaningful name, e.g., Room_1, North View, etc.).
- Go to Reports (click on the Reports tab). The Reports - Report dialog will open.
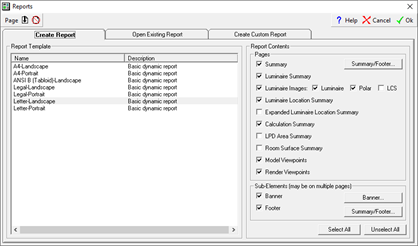
- On the default tab (Create a Report), in the Report Template section, select the paper size and orientation.
- Select the desired Report Contents:
- Summary: Selecting Summary will cause a Summary page to be created. This will be the first page in the report. Clicking on the Summary/Footer button will open a dialog where you can specify what to include on the Summary page. Fill in that information and click OK to return to the Reports - Report dialog.
- The Schedules that may be included in a dynamic report are selected here. They include Luminaire Summary, Luminaire Location Summary, Expanded Luminaire Location Summary, Calculation Summary, LPD Area Summary, and Room Surface Summary.
- Luminaire Images: If you have used luminaires from Instabases, and if they had images associated with the photometry files, you can include those images here. Selecting Polar or LCS will include the candela plot and LCS graphic, respectively.
- Viewpoints: Select this option to include any defined Viewpoints in Model Mode. Each Viewpoint will have its own page in the report.
- Render Viewpoints: Select this option to include any defined Viewpoints from Render Mode. Each Render Mode Viewpoint will have its own page in the report.
- Sub-Elements:
- Select Banner to include an image (JPG, PNG or BMP) at the top of the Summary page of the report. Click on the Banner button to specify the Banner image. (Click on the CONCEPTS tab at the top of this topic for additional information.)
- Select Footer to include a Footer at the bottom of each page of the report. Click on the Summary/Footer button to specify the Footer contents.
- After making the desired selections, click OK to close the dialog and create the report. (May take a few seconds, depending on the number of elements to be included.)
Modifying or Adding Content to a Dynamic Report
It may be desirable to modify a Dynamic Report after it has been created. Examples: Change Summary/Footer text, modify a schedule, add a schedule, add/remove content. etc. Once modified, the report's format can be saved and used with other AGI files. See the last section in this topic for information on saving a report.
In most cases, pages must be unlocked before modifications can be made. Unlocking a page replaces all dynamic content with proxies and <InsertTags> entities.
- Click on the Unlock All Pages button (or keyboard shortcut Ctrl-U) in the Reports Toolkit.
- Changing the Summary and/or Footer text:
- Click on the Report Properties button.
- Click on the Summary/Footer button.
- Make changes as desired.
- Click OK to close the Summary/Footer dialog.
- Click OK to save the changes.
- Modifying a dynamic Schedule (Schedules created by the report generator, not those created in Model Mode):
- In the Reports-Drawing/Schedules Toolkit, click on the Edit Schedule button.
- Select the Schedule to be edited (place the pick box attached to the cursor on a line of the schedule and left-click).
- Make the desired changes to the Schedule. Note: If the Schedule is broken into multiple pages, you will need to edit the Schedule on each page.
- Click OK to close the Edit Schedule dialog.
- Tip: If you plan on making permanent changes to a dynamic schedule (to be used in future reports), open and edit the report without any file loaded. This ensures no propagated pages. In other words, you will only have to edit one page per Schedule.)
- Adding a non-propagating Schedule (such as Isolines Legend) or Text to a dynamic page (has "+" in name):
- Select the Unlock All Pages command (or keyboard shortcut Ctrl-U) in the Reports Toolkit.
- Go to the page to which you wish to add content.
- Add the desired Schedule(s) or Text to the page via the Schedule or Text command in the Drawing/Schedules Toolkit.
-
Adding a non-propagating Schedule (such as Isolines Legend) or Text to a new, non-dynamic page:
- Select the Unlock All Pages command (or keyboard shortcut Ctrl-U) in the Reports Toolkit.
- Select the Insert a Blank Page command. Note: When inserting a blank page into a Dynamic Report, the page may not be blank. SmartText entities and <InsertTags> entities for the footer will be included on the new page (a time saver). In addition, the <InsertTags> entity for the page caption (if present) will be displayed as "Caption," which facilitates easy modification via the Edit Text command.
- Add the desired Schedule(s) to the page via the Schedule command in the Drawing/Schedules Toolkit.
- Adding or removing content (generally applies to Drawing entities and Text):
- To delete a page, go to that page and then select the Delete Page command in the Reports Toolkit.
- To delete content on a page, go to that page, click on the appropriate command in the Drawing/Schedules Toolkit (e.g., Delete Schedule, Delete Text), select the item to be deleted, and then right click to complete the command.
- Once modifications to the report are complete select the Lock All Pages command (or keyboard shortcut Ctrl-L) to display the dynamic content (actual Viewports, images, etc.).
Note: Be sure to Lock All Pages prior to printing in order to see the appropriate content. In Reports, what you see is what you get (WYSIWYG). In other words, if proxies are showing when you initiate the print command, proxies will be printed.
Saving a Dynamic Report for Use With Other AGI Files
This is done via the Save Report command in the Reports Toolkit.
Note: When saving a Dynamic Report (i.e., one that was created on the Create Report tab), all propagated pages (e.g., +2, +3, etc.) are removed. This ensures the report will propagate properly when used with another file.
TIP: When creating a new Sample Report to use with future projects, it is best to create it as a New (blank) AGI file, i.e., with no specific file content loaded.
Adding a Dynamic Viewport or Imageport to an Existing Report
It may be desirable to modify an existing report, such as a Sample Report or one previously saved, by adding dynamic Viewports or dynamic Imageports. Once modified, the report's format can be saved and used with other AGI files. See the previous section in this topic for information on saving a report.
In most cases, pages must be unlocked before modifications can be made. Unlocking a page replaces all dynamic content with proxies and <InsertTags> entities.
- Start with a New File (i.e., no job file loaded).
- Click on the Reports tab; select Open Existing Report tab; select the report to be modified and click Open.
- To add a Dynamic Viewport:
- Go to the page in the report that already has a Viewport.
- Right-click on the Viewport and select Properties.
- Select the View Type: Dynamic Viewpoint. The <InsertTag> indicator for the next available ViewPoint is automatically inserted (e.g., <InsertView_ViewPt_1>). See Guide to <InsertTag> Options at bottom of this topic.
- TIP: Dynamic Viewports will only pick up Viewpoints that have been created in Model Mode.
- To add a Dynamic Imageport:
- If an Imageport does not already exist:
- Go to the page where you wish to place a dynamic Imageport.
- Select the Create Imageport command.
- Go to the Proxy tab and select the Proxy image whose size best fits the page.
- Click OK. The dynamic image was automatically selected (checked), with the next available <InsertTag> indicator automatically assigned. See Guide to <InsertTag> Options at bottom of this topic.
- If an Imageport already exists in the report:
- Go to the page with the existing Imageport.
- Right-click on the Imageport and select Properties.
- Select Dynamic Image; then select the image type from the drop-down list. Example: For Render View, select <InsertImage_RenderFiew_1>. See Guide to <InsertTag> Options at bottom of this topic.
- If an Imageport does not already exist:
Adding Propagating Viewport and Imageport Pages to an Existing Report
It may be desirable to modify an existing report, such as a Sample Report or one previously saved, by adding new, propagating Viewport or Imageport pages. Once modified, the report's format can be saved and used with other AGI files. See the last section in this topic for information on saving a report.
In most cases, pages must be unlocked before modifications can be made. Unlocking a page replaces all dynamic content with proxies and <InsertTags> entities.
- Start with a New File (i.e., no job file loaded).
- Click on the Reports tab; select Open Existing Report tab; select the report to be modified and click Open.
-
Identify the report's current Viewport and Imageport pages. Important: there should be no more than one Viewport page and one Imageport page.
- In the Reports Toolkit, click on Report Properties command (has a hammer, like the Edit commands).
- In the Report Properties dialog:
- Change the page Number shown to be that of the Viewport page (determined in Step 3).
- In the PageName drop-down list, select ViewPt+. The page is now set to automatically propagate based on the number of Viewpoints defined in Model Mode.
- Change the page Number shown to be that of the Imageport page (also determined in Step 3).
- In the PageName drop-down list, select RenderView+. The page is now set to automatically propagate based on the number of Render Views (set in Render Mode). See Guide to <InsertTag> Options at bottom of this topic.
- Click OK to save these Report Properties settings.
-
After the Report Properties dialog closes, at the bottom of the screen select the ViewPt+ page.
- Right-click on the Viewport. Select Properties.
- Select View Type: Dynamic Viewpoint. The <InsertTag> indicator for the next available ViewPt is automatically inserted (e.g., <InsertView_ViewPt_1>).
- To add a propagating caption: Use the Text command (Drawing/Schedules Toolkit) to add this text to the page: <InsertText_Caption_1> .The caption will display Viewpoint on the first page and Viewpoint--Cont. on all propagated pages.
- Tip: Can have multiple Viewports on a page. Easiest way to add additional Viewport(s) is by copying the Viewport must modified. (Right-click on the Viewport, select Copy, right-click to Paste.) The <InsertTag> indicator automatically increments. See Guide to <InsertTag> Options at bottom of this topic.
- Once complete, use the Save Report command to save this modified report format for future use (suggestion: rename it so that it is different from the original report). To use the saved report, select the Open Existing Report tab in the Reports- Report dialog.
Guide to <Insert Tag> Options
| Insert Tag | Mapping When Locked |
| <Insert_Caption_#> | Mapped to Dynamic Page Name where # is always 1 (See examples below) |
| <InsertImage_Banner> | Maps Banner image to Imageport |
| <InsertImage_LumImage_#> |
Maps Luminaire Image to Imageport, where # corresponds to the order in the Defined Luminaires list. Only definitions located in the environment are included! If # does not exist, Imageport is not displayed. Notes: - Description can contain one or more replacement labels intermixed with text. Examples:
|
| <InsertImage_LumPolar_#> | Maps Luminaire Polar Graph to Imageport, where # corresponds to the order in the Defined Luminaires list. Only definitions located in the environment are included! I # does not exist, Imageport is not displayed. |
| <InsertImage_LumLCS_#> | Maps Luminaire LCS Graph to Imageport, where # corresponds to the order in the Defined Luminaires list. Only definitions located in the environment are included! I # does not exist, Imageport is not displayed. |
| <InsertImage_RenderView_#> | Maps Render View to Imageport, where # corresponds to the alphabetical order of the defined Render Views (by View Name). If # does not exist, Imageport is not displayed. |
| <InsertView_ViewPt_#> | Maps ViewPt to Viewport, where # corresponds to the alphabetical order of the defined Viewpoints (order in which they were created). If # does not exist, Viewport is not displayed. |