
IES Indoor Report Polar Curves
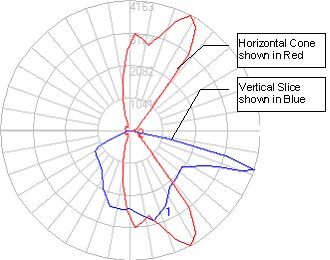
The Polar Curves tab displays a user definable polar representation of any vertical slice (horizontal angle) or conical slice (cone through light center and any vertical angle) of the light distribution. When the window is first opened the vertical plane and horizontal cone through the maximum candela location are displayed. The vertical plane is shown in blue, the horizontal cone in red. Each representation shows a complete slice or cone through all of the horizontal angles within the photometric file.
Select any other vertical plane or horizontal cone by clicking in the appropriate selection boxes and specifying the angle and color you wish to use.
Scaling
The polar plot scale is controlled by the overall maximum candela value. You may change the plot scale easily by simply entering a different candela value to be used as the plot extents.
Hint: Using a consistent plot scale across multiple photometric files allows you to compare light distributions for these files on a consistent and equal basis.
Reading Polar Curves
Polar curves are based on the candela values within the candela array. By plotting the candela values on a polar diagram, we can see the luminaire performance in any two dimensional plane.
The polar diagram is divided into four rings, each representing a 25% increase in magnitude. At the center of the polar diagram, the candela intensity equals 0. At the outer ring, the candela intensity equals the maximum candela value. The inner ring represents 25% of the maximum value, the second ring 50% of the maximum, and the third ring 75% of the maximum. As the candela values increase in magnitude (increase in intensity) they move towards the outer portions of the polar diagram.
Radiating along the diagram are angular increment lines - each representing a 10 degree angle increment. By following the angular increments to the horizontal cone or vertical slice, it is easy to approximate the candela value for any location on the polar plot.
More information is provided in the Photometry 101 topic.