
Luminaire Define - Metrics Section
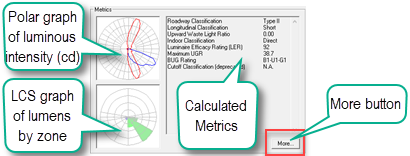
The Metrics section does not require any input, it is simply a technical display to assist in evaluation of the selected luminaire photometry. There are three unique displays plus a More button that enlarges the two graphs and makes them interactive.
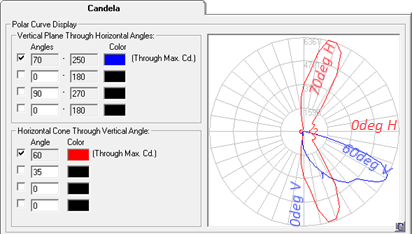
The polar graph of luminous intensity is also known informally as a graph of candela curves. The industry standard display of information for Type C photometry includes the Horizontal Cone through maximum candela (shown in red) and the vertical plane of the horizontal angle containing the maximum candela (in blue). The default display of information can be user controlled using the More button (images below).
This graphical information is often difficult for all but the most seasoned professionals to understand and we encourage you to use the More button to adjust the angles and experiment. Both a Plan view (red) and an elevation view (blue) are plotted on the same graph. The graph represents different angles for each. For a quick lesson see our YouTube video.
Horizontal Cone - This is a conical slice (though it does not look like a cone) viewed looking down from above (Plan view) through the maximum candela value. In the case below this occurs at 60 degrees up from Nadir (Nadir is straight down). That's why it is referred to as conical, it's not flat.
Vertical Plane - This is a graph of candea for each vertical angle measured when sliced through the horizontal plane containing the maximum candela value. In this case it is at 70 degrees H (horizontal). This is an elevation view of that plane.
For a great explanation of the graphs for Type C photometric reports please watch our YouTube video.
Type B Photometry
The candela graph for Type B photometry (specific to floodlight and projection luminaires) is displayed in a Cartesian format which is industry standard for type B data. This displays the axial intensity distribution left to right (H in blue) and bottom to top (V in red). The center beam intensity is in the middle for both graphs. Type B angles range from -90 to +90 in both axial displays. Type B data has no backlight (light behind the luminaire.
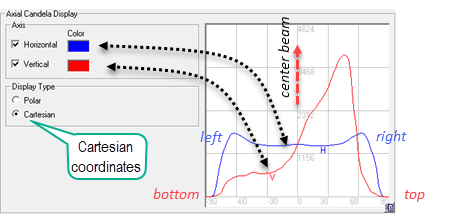
The red curve represents a vertical slice through the center of the light distribution from below beam center (left side of graph) to above beam center (right side of graph), (imagine the luminaire is aimed at the horizon). The Blue curve represents a horizontal slice through the center of the light distribution from left to right. Visualize the Red curve as being the vertical beam spread and the blue curve as the horizontal beam spread.
Related Topics
Luminaire Classification System (LCS) Graph
This refers to the Backlight, Uplight and Glare rating system (BUG), as established by the Illuminating Engineering Society (IES) and the International Dark-Sky Association (IDA). BUG is calculated for Type C photometry only. The details of this system are described in the IES document TM-15-11, Luminaire Classification System for Outdoor Luminaires. The LCS system replaces the legacy Cutoff system previously based on relative photometric testing for HID (and other sources) luminaires. The LCS system is based on total lumen output as opposed to lamp lumens and is more suitable for LED sources.
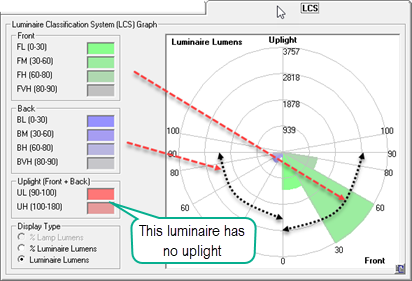
- LCS Zones: Front - Low, Medium, High, Very High; Back- Low, Medium, High, Very High; Uplight - Low, High
- Lumens - The calculated zonal lumens within each LCS zone. Values are rounded for display purposes. Any zonal lumen value that is greater than 0 but less than 0.05 will be displayed as "<0.05" rather than being rounded down to 0.
- % Lamp - The percentage of total lamp lumens within each LCS zone. Values are rounded for display purposes.
- % Lum - The percentage of luminaire lumens within each LCS zone. Values are rounded for display purposes.
- Total - The sum of each column totaling lumens, % Lamp and % Luminaire. The rounded values are used to sum the results.
- Roadway Classifications:
- IES Classification (Type I, II, III, IV, V and VS) - This classification describes the lateral (across the road) light distribution with regard to the lighted area width in terms of the mounting height (MH) ratio. Note: The Roadway Classification will be N.A. for a photometric data file that meets any of these conditions: maximum candela value at or above 90 degrees vertical; maximum candela value occurs on the "house side" (i.e., behind the luminaire) (exception Type V or VS); or asymmetric distribution where "Type" is not the same in the 0-90 and 270-360 quadrants.
- Longitudinal Classification (Very Short, Short, Medium, Long and Very Long) - This classification describes the distribution of light along the roadway. The classification is calculated by determining the location of the maximum candela point in terms of the mounting height ratio. Note: Longitudinal classifications will be N.A. for any of the same conditions as for the IES Classification ("Type").
- Cutoff Classification (Full Cutoff, Cutoff, Semi-Cutoff and Non-Cutoff) -The Cutoff classifications are based on the candela values measure at 80 degrees above nadir and higher, in any horizontal angle. The luminaire cutoff classification was deprecated by the IESNA in 2007; it is superseded by the Luminaire Classification System (LCS) also known as BUG. Cutoff classification cannot be assigned to an absolute photometry file; N.A. is displayed instead.
- Upward Waste Light Ratio (UWLR) - This is the luminaire lumens emitted at 90 degrees and above divided by the total luminaire lumens.
- Indoor classifications:
- CIE classification (Direct, Semi-Direct, General Diffuse, Semi Indirect and Indirect)
- Luminaire Efficacy Rating (LER) - This classification is a measure of a luminaire's energy efficiency. LER is a measure of the luminaire's rated lumen output divided by its input power.
- Max UGR - This is the maxium Unified Glare Rating value from the standard UGR table corrected for luminaire lumen output (output of this luminaire). See Photometric Toolbox for more detail on UGR tables.
- Flood classification (Only shown for Type B photometry):
- Flood NEMA Type - The IES NEMA type is determined by the location of the 10% maximum candela value in the axial angles of the Type B photometric web. For example: If 10% of the maximum candela value falls between 46 and 70 degrees the designation is NEMA type 4 in that direction (horizontal or vertical).
- BUG Rating (LCS Metrics, Only shown for Type C photometry)
- BUG Rating - Refers to the lumens present in the various zones described by the LCS system. BUG stands for Backlight, Uplight and Glare. The LCS zones are described above.
LCS / BUG / LER metrics - Details
- The calculated LCS metrics(including BUG rating) are automatically updated to reflect any changes to the Lumens Per Lamp value in the luminaire definition when the definition is Added or Redefined. When you initially change the lumen value, the LCS data and graph will indicate ‘Pending –Add/Redefine – Lumens have been changed’. The data will be updated and displayed as soon as you click the Add/Redefine button. This feature allows you to generate accurate LCS data and an accurate BUG rating for luminaires with prorated lamp lumen values.
- The calculated LER metric is automatically updated to reflect any changes to the Luminaire Lumens and/or Total Watts values in the definition when the definition is Added or Redefined. When you initially change the watts value, the Classification will display ‘Pending Add/Redefine – Watts have been changed’. The data will be updated and displayed as soon as you click the Add/Redefine button.
- LCS and BUG rating information will not be generated for Type B photometric data (floodlights), as LCS is undefined for Type B photometry.
- Important: LCS, BUG and LER metrics displayed in the Instabase are based on the test report lumen and watts values. Prorating the Lumens per Lamp and/or watts values in the luminaire definition will result in different LCS, BUG and /or LER metrics in the Luminaire Definition dialog than what is shown in the Instabase dialog!
- Linking to Photometric Toolbox from within the Luminaire Define dialog will include the lumen and watts values specified in the luminaire definition (not the original test data) to ensure that all generated reports in Photometric Toolbox are based on these modified values (this has changed from previous versions).
- Type "C" reports (commonly mislabeled
Type "A") will generate Indoor, Roadway, LCS and BUG rating Classification
information. Exceptions:
- Indirect photometric files will not display Roadway Classification information.
- Cutoff categories are not defined for absolute photometry; therefore, Cutoff will display as N.A. for absolute photometry files.
- Roadway Classifications (Type and Longitudinal Class) are not calculated (N.A.) for photometric files where: Maximum Candela Vertical Angle ≥ 90 degrees, Maximum Candela Horizontal Angle falls on House Side (exception Type V or VS) or asymmetric distributions where 'Type' is not the same in the 0-90 and 270-360 quadrants.
- Type "B" reports, generally used to describe floodlights, will generate Flood classifications and LER (Luminaire Efficacy Rating). They will not generate LCS or BUG metrics.
Printing from the More dialog
The print button within the More dialog will print a pre-formatted output page with the candela curves you have selected. Included in the output are: the photographic image associated with the selected luminaire (if it exists); your logo or the AGi32 logo (set your logo from the AGi32 File Menu, Banner setting); an echo of the description section from the IES file; the classification as computed by AGi32 and a description of the candela information plotted.