
![]()
Photometric File Type C - Concepts
Candela Graph
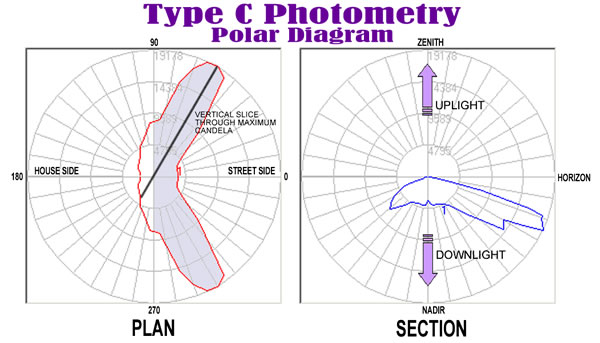
Type C Photometry is used to indicate the light distribution for architectural lighting products (interior and area lighting luminaires). Type B Photometry is used for floodlight distributions.
When viewing Type C polar curves in AGi32, the horizontal cone and vertical slice through the maximum candela point is shown by default. In general, this is analogous to viewing the photometric web in Plan and Section view at the most luminous location.
Plan View
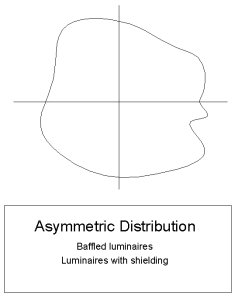
Begin by looking at the horizontal cone (the Plan View). This shape indicates the horizontal directionality of the luminaire with respect to its testing position and any symmetry it exhibits.
|
|
|
|
|
|
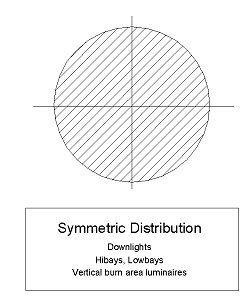
- Symmetric Distribution - A symmetric distribution will appear as a circular cone at the outmost edge of the polar plot.
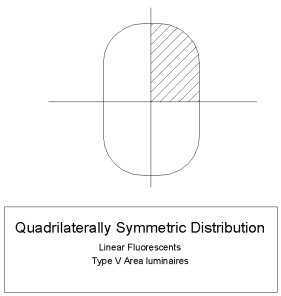
- Quadrilateral Symmetry - A quadrilaterally symmetrical distribution will present a horizontal cone that is symmetrical in each of the 4 quadrants of the polar plot. The horizontal cone may be square, elliptical or irregular, however, each quadrant is exactly the same as the other 3.
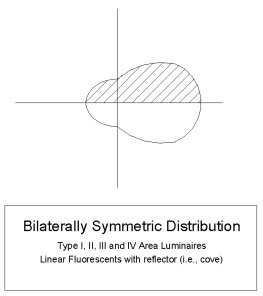
- Bilateral Symmetry - A bilaterally symmetric distribution presents a horizontal cone that is symmetric about the 0-180 horizontal plane. These photometric distributions generally present a more directional thrown towards the Street Side (forward throw). Another case of bilateral symmetry occurs when the luminaire is tested such that it is symmetrical about the 90-270 photometric plane.
- Asymmetric Distribution - An asymmetric distribution presents a horizontal cone that contains no symmetry or one that is symmetrical in a manner not described by the symmetrical distributions described previously.
- House Side / Street Side - Horizontal values between 270° and 90° are in front of the luminaire and are referenced as "Street Side". Horizontal values between 90° and 270° are behind the luminaire and are referenced as "House Side" (this assumes counterclockwise rotation).
Section View
The Vertical plane is also taken through the maximum candela angle. When viewing the Vertical plane, you are looking at a section of the photometric web from the side, perpendicular to the maximum candela angle.
The vertical plane provides us with the luminaire's vertical distribution type and cutoff characteristics.
- The horizontal line separating the upper and lower portions of the polar plot represents Horizon. When the vertical plane is shown below the Horizon, the distribution produces light in the downward direction. When the vertical plane is shown above the Horizon, the distribution produces light in the upward direction. When the vertical plane is shown above and below Horizon, the luminaire produces both uplight and downlight (not necessarily equally).
- The horizontal symmetry discussed in Plan View will also be apparent in Section View.
- Cutoff characteristics - Cutoff classifications are based on the proportion of the maximum candela value present at 80° and above.
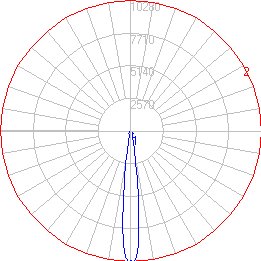
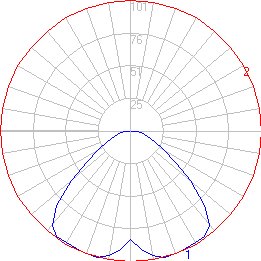
- The vertical angle that produces the maximum candela is displayed in Section view. This information describes how wide or narrow the luminaire distribution is.
|
Narrow Distribution (Vertical Plane) |
Wide Distribution (Vertical Plane) |
Show me more information about Type B Photometry
LCS Graph
The IES Luminaire Classification System for Outdoor Luminaires (LCS) defines the distribution of light into 10 solid angles, from which the Backlight-Uplight-Glare (BUG) ratings are determined. The LCS metrics are an indicator of optical distribution and are intended to be used in conjunction with the IES Longitudinal Classifications (Types I - V and VS) to provide a thorough analysis of the light distribution of outdoor luminaires. The application of BUG ratings is addressed in individual IES Recommended Practices, the intention being to provide data that allows evaluation of the potential for light trespass, sky glow and glare.
The LCS metrics within each zone are reported in lumen totals as well as percent lamp lumens (when applicable) and percent luminaire lumens.
Additional Information can be found in the IES document TM-15-11.