

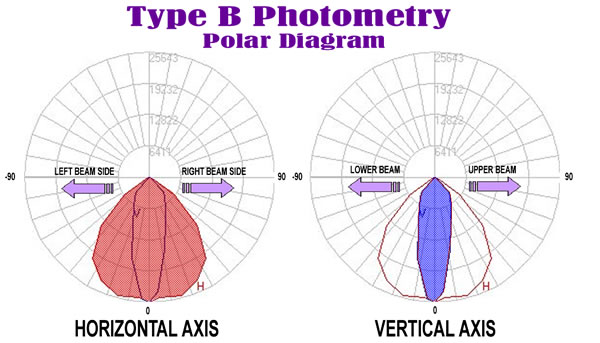
When viewing Type B polar curves in PTB, the axial candela through the Horizontal and Vertical Axes are shown. These are the only candela values shown for this photometry type.
The polar diagram is divided into four rings, each representing a 25% increase in magnitude. At the center of the polar diagram, the candela intensity equals 0. At the outer ring, the candela intensity equals the maximum candela value. The inner ring represents 25% of the maximum value, the second ring 50% of the maximum, and the third ring 75% of the maximum.
Radiating along the diagram are angular increment lines - each representing a 10 degree angle increment. By following the angular increments to the horizontal cone or vertical slice, it is easy to approximate the candela value for any location on the polar plot.
Horizontal Axis
The Horizontal axis displays the luminous distribution from the left side of the beam (-90) through the beam center (at 0) to the right side of the beam (90. Although most beams are symmetrical in the Horizontal axis, they are not required to be.
Vertical Axis
The Vertical axis displays the luminous distribution from the bottom of the beam (-90) through the beam center (at 0) to the top of the beam (90. The maximum candela often occurs at the vertical beam center, but it may also occur above or below this point, or even off center depending on the floodlight's distribution.
Cartesian Diagrams
Type B Photometry may also be plotted on a Cartesian axis instead of a polar diagram. Cartesian diagrams display the same type of information as a Polar diagram.
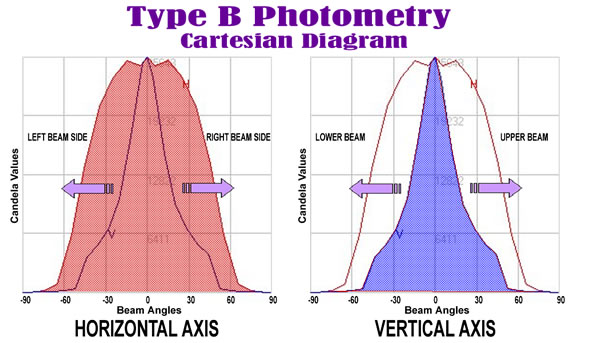
The Cartesian graph is divided into grids along the X and Y axis. The X axis is hatched by vertical grid lines, each representing 30 degree increments. The vertical line at the center of the Cartesian axis represents the 0 degree plane The Y axis is hatched by horizontal grid lines, each representing a 25% increase in magnitude of candlepower. The topmost horizontal line represents the maximum candela value (or maximum scaling value). Both horizontal and vertical distributions may be read in the Cartesian graph by plotting their locations relative to the nearest grid line.
NEMA Beam Spread
The IES or NEMA typing is determined by the location of the 10% maximum candela value in the axial angles of the Type B photometric web. For example: If 10% of the maximum candela value falls between 46 and 70 degrees the designation is NEMA type 4 in that direction (horizontal or vertical).
|
NEMA Type |
Field Angle degree range |
|
0* |
< 10 |
|
1 |
10 to 18 |
|
2 |
18 to 29 |
|
3 |
29 to 46 |
|
4 |
46 to 70 |
|
5 |
70 to 100 |
|
6 |
100 to 130 |
|
7 |
130 and up |
* NEMA Type 0 is actually considered a spotlight instead of a floodlight.