3D Compare Plot
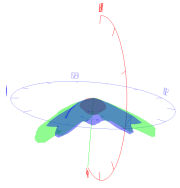
The 3D Compare Plot tab allows you to view the three dimensional photometric distributions as solid transparent or wireframe forms. The colors allocated to each photometric web are related to the files loaded into the Compare Tool (file #1 is assigned Red, file #2 is assigned Green and file #3 is assigned Blue)
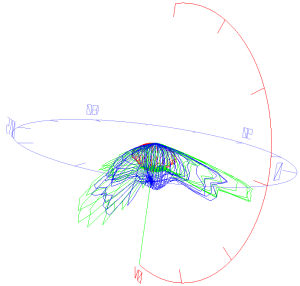
The 3D Compare Plot is useful for ascertaining how the photometric distributions overlap and differ (in spread as well as intensity) as well as gauging the density of the testing angles within photometric distribution. The Display Lines option shows the horizontal and vertical testing angles, a denser, smoother web indicates more specific intensity values in the test.
Included Files
Each photometric file is listed by name at the top of the 3D Compare Plot tab. To deselect a file and hide it from view, uncheck its name from this location.
Rotating the Display
The photometric distributions may be rotated for more thorough analysis by clicking and dragging the mouse in the 3D display.
Zoom Buttons
To see the photometric distributions in more detail, use the Zoom buttons to Zoom In, Out and Zoom Extents. Holding down the Shift key on the keyboard while dragging may also be used to Zoom In and Out (Shift + Drag Upwards to Zoom In, Shift + Drag Downwards to Zoom Out).
When viewing multiple photometric distribution that vary widely in intensity values, you may need to Zoom In on the lowest intensity distribution to see it in detail.
|
Zoom Button |
Function |
|
|
Zoom In - Zooms in current view by 10% |
|
|
Zoom Out - Zooms out in current view by 10% |
|
|
Zoom Extents - Displays extents of selected distributions and Heads Up Display (HUD) |
3D Options
Tumble - This selection produces an automatic rotation of the photometric webs to show off their shape and orientation. The Tumble Settings are controlled in the Compare Settings dialog.
HUD - The Heads Up Display is enabled in the Compare Tool by default. Depending on the photometric type being displayed, the HUD will contain various types of information.
|
Type C Photometry - Nadir is indicated at the bottom of the display (indicated with a 0V notation) and Zenith at the top (indicated with a 180V notation). A red hemicircle runs between the 0 and 180 degree vertical angles in the 0 degree horizontal plane, with hatch marks indicated every 30 degrees. Horizon is indicated with a yellow horizontal circle at the center of the photometric web. Any portion of the photometric web present above this circle indicates uplight, any portion below - downlight. This circle is also hatched into 30 degree horizontal angle increments, with the primary photometric angles indicated every 90 degrees (0, 90, 180 and 270). |
|
|
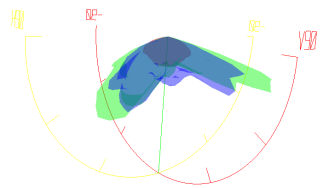
Type B Photometry - Nadir is indicated at the bottom of the display (indicated with a 0V notation). Both the vertical and horizontal angular hemicircles run through this point. A red hemicircle runs between the -90 and 90 degree vertical angles in the 0 degree horizontal plane, with hatch marks indicated every 30 degrees. Use this hemicircle to gage the width and symmetry of the lower and upper portions of the beam. A yellow hemicircle runs between the -90 and 90 degree horizontal angles in the 0 degree vertical plane, with hatch marks indicated every 30 degrees. Use this hemicircle to gage the width and symmetry of the left and right portions of the beam. |
|
Max Candela - This option displays the maximum candela locations for each displayed photometric web, indicated by a fuchsia hatch mark. Photometric webs exhibiting quadrilateral or bilateral symmetrical distributions will have multiple maximum candela locations.
Photometric
This section indicates whether to display the selected photometric with a Type C or Type B Heads Up Display. See the HUD paragraph above for details on each display type.
Display
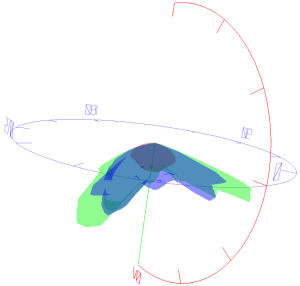
Choose whether to display the three dimension photometric webs using transparent solid forms or lines. Transparent forms are useful for gauging overall form and spread, while lines are helpful for evaluating the intensity measurement density.
|
Display Solid |
Display Lines |