![]()
Highlight Values - Concepts
Ranges of Highlight Values can be assigned to replace the defined text color of all calculation entities provided in AGi32. These ranges are extremely useful to designers to evaluate which points fall above or below target values. In addition, the Highlight Values dialog allows for the specification of global colors for the maximum and minimum values for each metric.
The last accessed tab is saved and recalled when the dialog is recalled in the current session.
Value Ranges
By default, you are provided with up to 5 customizable value ranges, using a grayscale palette. When specifying Highlight Values, you match a particular range to a particular shade. Values corresponding to lower ranges, can be linked to the darker grayscale colors, to indicate lower light levels. Conversely, values corresponding to higher ranges, can be linked to the lighter colors, to indicate higher light levels. It is not necessary to fill in all of the Value Ranges boxes or indicate the values, between ranges, in any particular order. Only positive values are used for all tabs except Visibility Level (STV); empty boxes are ignored. In the Visibility Level tab you may specify positive, negative or zero values empty boxes are ignored.
You may specify alternate colors for all of the color options in the Highlight Values dialog.
Foreground vs. Background
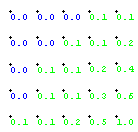
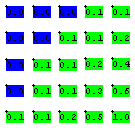
The Highlight Value color may be applied to the text itself (Foreground) or to a box behind the text (Background). At greater Zoom distances, the Background Color option provides an easier way of seeing the highlighted values.
|
Foreground Color
|
Background Color
|
Uniformity Gradient (UG) is typically used to measure uniformity in sports lighting applications. However, it can be used to measure the rate of change for any calculated metric. This metric measures how fast the values falls off between measuring points. Specifically, the UG measures the rate of change of values between adjacent measuring points, side to side, up, down or diagonal. The rate of change is weighed by the distance between the points (the greater the distance, the smaller the rate of change).The UG value is expressed as a ratio of values.
The reported UG value indicates the highest ratio or greatest rate of change.

