
View 2D Photometric Representation
The 2D tab displays a user definable Polar or Cartesian representation of any vertical slice (horizontal angle) and conical slice (cone through light center and any vertical angle) through the photometric web.
![]() When the window is first opened the vertical plane and
horizontal cone through the maximum candela location is displayed. The
vertical plane is shown in blue, the horizontal cone in red. Each representation
shows a complete slice or cone through all of the horizontal angles within
the photometric file.
When the window is first opened the vertical plane and
horizontal cone through the maximum candela location is displayed. The
vertical plane is shown in blue, the horizontal cone in red. Each representation
shows a complete slice or cone through all of the horizontal angles within
the photometric file.
![]() Select any other vertical plane or horizontal cone by
clicking in the appropriate selection boxes and specifying the angle you
wish to use.
Select any other vertical plane or horizontal cone by
clicking in the appropriate selection boxes and specifying the angle you
wish to use.
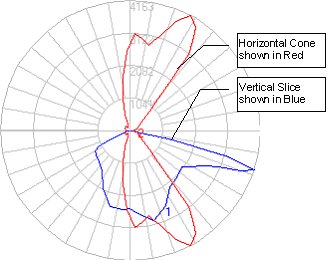
Polar curves are graphed from the candela values within the candela array. By plotting the candela values on a polar diagram, we can see the luminaire performance in any two dimensional plane.
The polar diagram is divided into 4 rings, each representing a 25% increase in magnitude. At the center of the polar diagram, the candela intensity equals 0. At the outer ring, the candela intensity equals the maximum candela value. The inner ring represents 25% of the maximum value, the second ring 50% of the maximum, and the third ring 75% of the maximum. As the candela values increase in magnitude (increase in intensity) they move towards the outer portions of the polar diagram.
Radiating along the diagram are angular increment lines - each representing a 10 degree step. By following the angular increments to the horizontal cone or vertical slice, it is easy to approximate the candela value for any location within the light distribution.
Reading Cartesian Plots
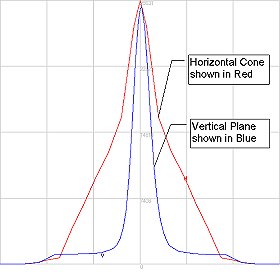
Cartesian diagrams display the same type of information as a Polar diagram. The intensity (cd) is graphed in a Cartesian system with Zero degrees (H or V) at the center of the plot. Angular increments move outward from zero to the left and right. In the case of Type C photometry, they may go to 180 degrees in 30 degrees steps. For Type B photometry the angles will go to –90 (left side) and +90 (right side) to depict the left and right sides of the light distribution.
The Cartesian graph is divided into grids along the X and Y axis. The X axis is hatched by vertical grid lines, each representing 30 degree increments. The vertical line at the center of the Cartesian axis represents the 0 degree plane The Y axis is hatched by horizontal grid lines, each representing a 25% increase in magnitude of candlepower. The topmost horizontal line represents the maximum candela value. Both horizontal and vertical distributions may be read in the Cartesian graph by plotting their locations relative to the nearest grid line.
More information is provided in the Photometry 101 topic.
Copy the 2D image
Click on the Copy button to create a bitmap image of the 2D plot on your Windows clipboard.