
The CU Graph window contains the coefficient of utilization curves and the Flux distribution for the selected IES photometric file.
In the CU Graph, the Street Side curve is shown in red and the House Side curve in blue.
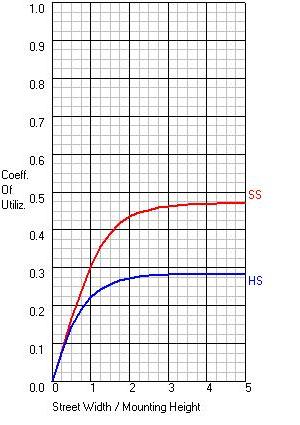
To determine the CU value for a given roadway width (light center at curb) : first divide the roadway width by the luminaire mounting height, reference this ratio on the abscissa (Street Width/Mounting Height), follow this point upwards until it intersects the Street Side CU curve, now read across to the ordinate and you have the coefficient of utilization value.
Flux Distribution
This table displays the lumen output and lamp percentages as a function of the street side and house side distributions. For absolute photometry, flux distribution is based on Percent Of Luminaire instead of Percent Of Lamp since lamp lumens are unknown.
HINT: Sum the downward street side lumens and the downward house side lumens, divide by rated lamp lumens and you have the total downward efficiency.