2D Compare Plot
The 2D Compare Plot tab allows you to choose which vertical planes and horizontal cones are displayed for each individual photometric file. By default, only the vertical planes are displayed and the vertical plane containing the maximum candela angle for each luminaire is chosen.
Vertical Plane
Select which vertical planes will be displayed in the polar graph. By default, a vertical plane is taken through the maximum candela angle for each photometric file. You may choose from a list of measured angles for each photometric file. For example, If a photometric file only contains candela values in the 0 degree Horizontal plane (symmetric distribution), only the 0 degree angle will be available.
Each vertical plane uses the reference color assigned to the photometric file (file #1 is assigned Red, file #2 is assigned Green and file #3 is assigned Blue).
It may not be possible to select the same angle for all luminaires, depending on the density of each test. In addition, the extents of the polar graph are scaled to the largest maximum candela value, so that one can see how the intensities are distributed and compare.
Photometric Toolbox automatically calculates the complete plane (on either side of nadir and/or zenith). For example, when the 0-degree horizontal plane is selected, the polar graph will display all of the vertical angles through the 0-180 horizontal plane. When the 45-degree horizontal plane is selected, polar graph will display all of the vertical angles through the 45-225 horizontal plane.
Match Angle - Selecting this checkbox restricts the same horizontal angular choice for all photometric files. The angular specification made in the pull-down menu for one file will be automatically applied to the other two. The last selected choice is applied to all three files (you may choose from any one of the list boxes) For example,when the 0-degree horizontal plane is selected for file #1,files #2 and #3 will also display their 0 degree angular data.
Horizontal Cone
Select which horizontal cones will be displayed in the polar graph. By default, horizontal cones are not displayed, to provide a cleaner comparison. For horizontal cones, select the desired vertical angles to circumscribe. You may choose from a list of measured angles for each photometric file. For example, If a photometric file contains candela values every 10 vertical degrees, only the 10 degree angle increments will be available.
Each vertical plane uses the reference color assigned to the photometric file (file #1 is assigned Red, file #2 is assigned Green and file #3 is assigned Blue).
Photometric Toolbox automatically displays the complete cone (displaying all vertical angles through 360 degrees).
Match Angle - Selecting this checkbox restricts the same vertical angular choice for all photometric files. The angular specification made in the pull-down menu for one file will be automatically applied to the other two. The last selected choice is applied to all three files (you may choose from any one of the list boxes) For example,when the 45-degree vertical plane is selected for file #1,files #2 and #3 will also display their 45 degree angular data.
Setting up 2D Compare Plots for printing
Add Plot - Clicking this button will add the current Angular specifications (both vertical and horizontal, if selected) to the Plot list for printing. Each Plot will be printed on its own page as part of a comprehensive Compare Report.
Delete Plot - Clicking on this button will remove the highlighted plot from the Plot list.
Related Links
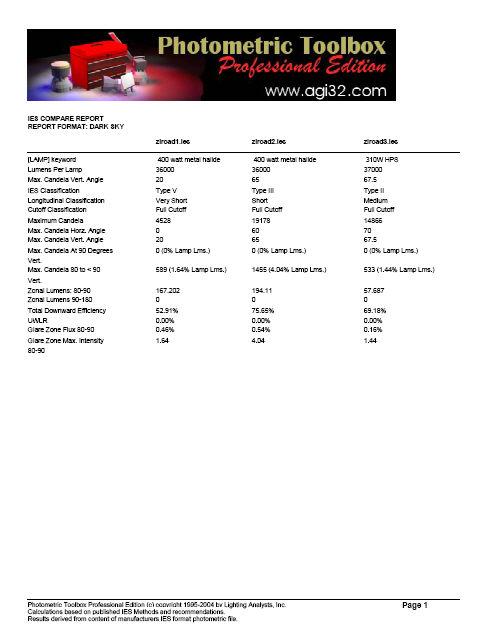
 Sample Compare Report